 Alec Furrier
Lecture on Tuesday, Commit on Wednesday: What Harvard's Machine Learning in Finance Course Is Changing in My Trading Stack
This fall I'm taking Harvard's CSCI E-278, Applied Quantitative Finance and Machine Learning. The rule: every week's lecture becomes a change in the Traders.Money codebase. Three weeks in, it has changed how we measure, not what we trade.
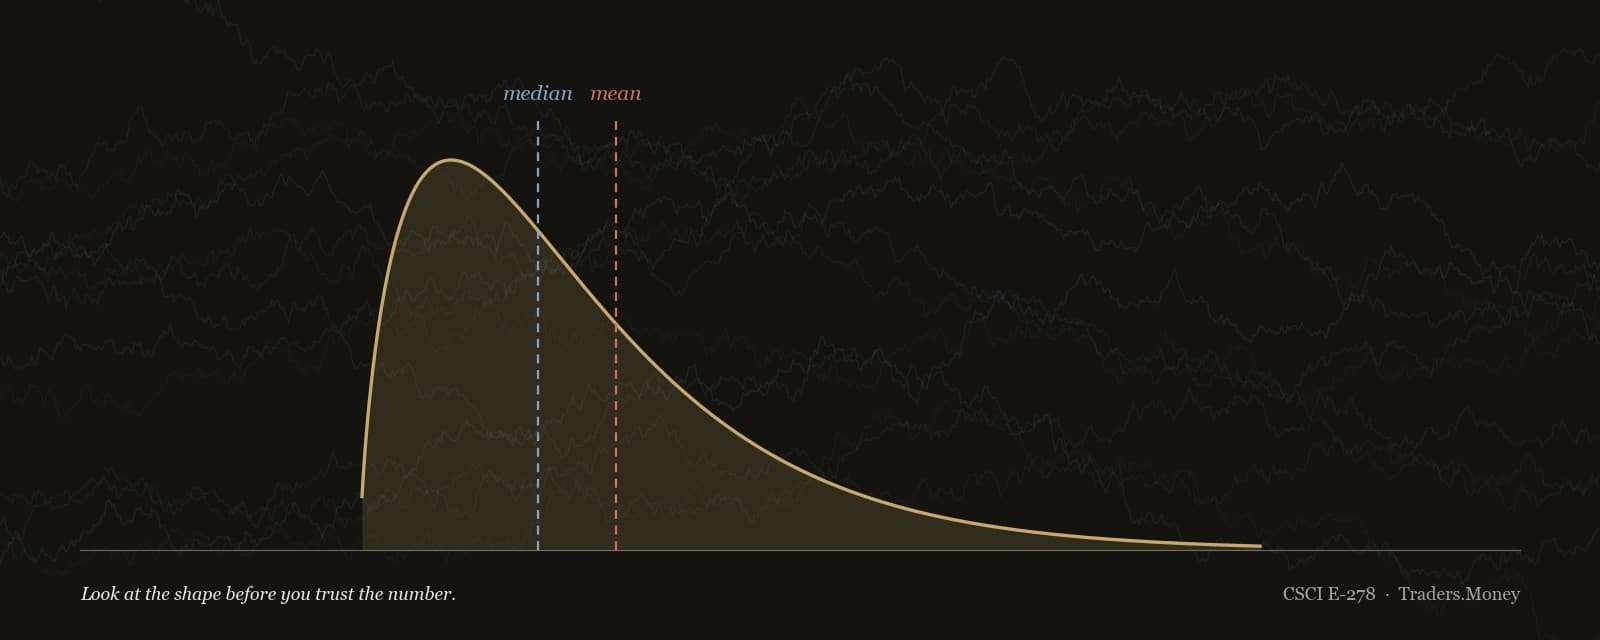
This fall I'm taking CSCI E-278, Applied Quantitative Finance and Machine Learning, at the Harvard Extension School. The course runs through December and is built around Dixon, Halperin, and Bilokon's Machine Learning in Finance.
On September 2, before the first assignment was due, I set one rule for myself:
Every week, the lecture and the matching textbook chapter go into the Traders.Money codebase.
Notes don't count. A lesson counts once it's a test, a report, or a check that runs against real code. Three weeks in, here is what that has looked like, and what it has not.
Why a trading founder is back in class
The one-line vision for Traders.Money is do for trading what AI did for coding.
AI didn't make everyone a programmer. It made intent executable: describe what you want, an agent writes it, a test suite tells you the truth, and only working code ships. The model is increasingly a commodity. The value is in the tools it calls and the tests that keep it honest.
Trading has the same shape. Describe a trading idea in plain English, compile it into a strategy, run an honest backtest, and let only the edge that survives reach capital. Our moat isn't "an LLM that trades." It's the toolchain underneath: the backtester, regime detection, the covariance engine, and the risk gates.
A toolchain like that is only as good as the statistics inside it. That's what E-278 is for. It teaches the math that decides whether a number on a dashboard is telling the truth.
The weekly loop
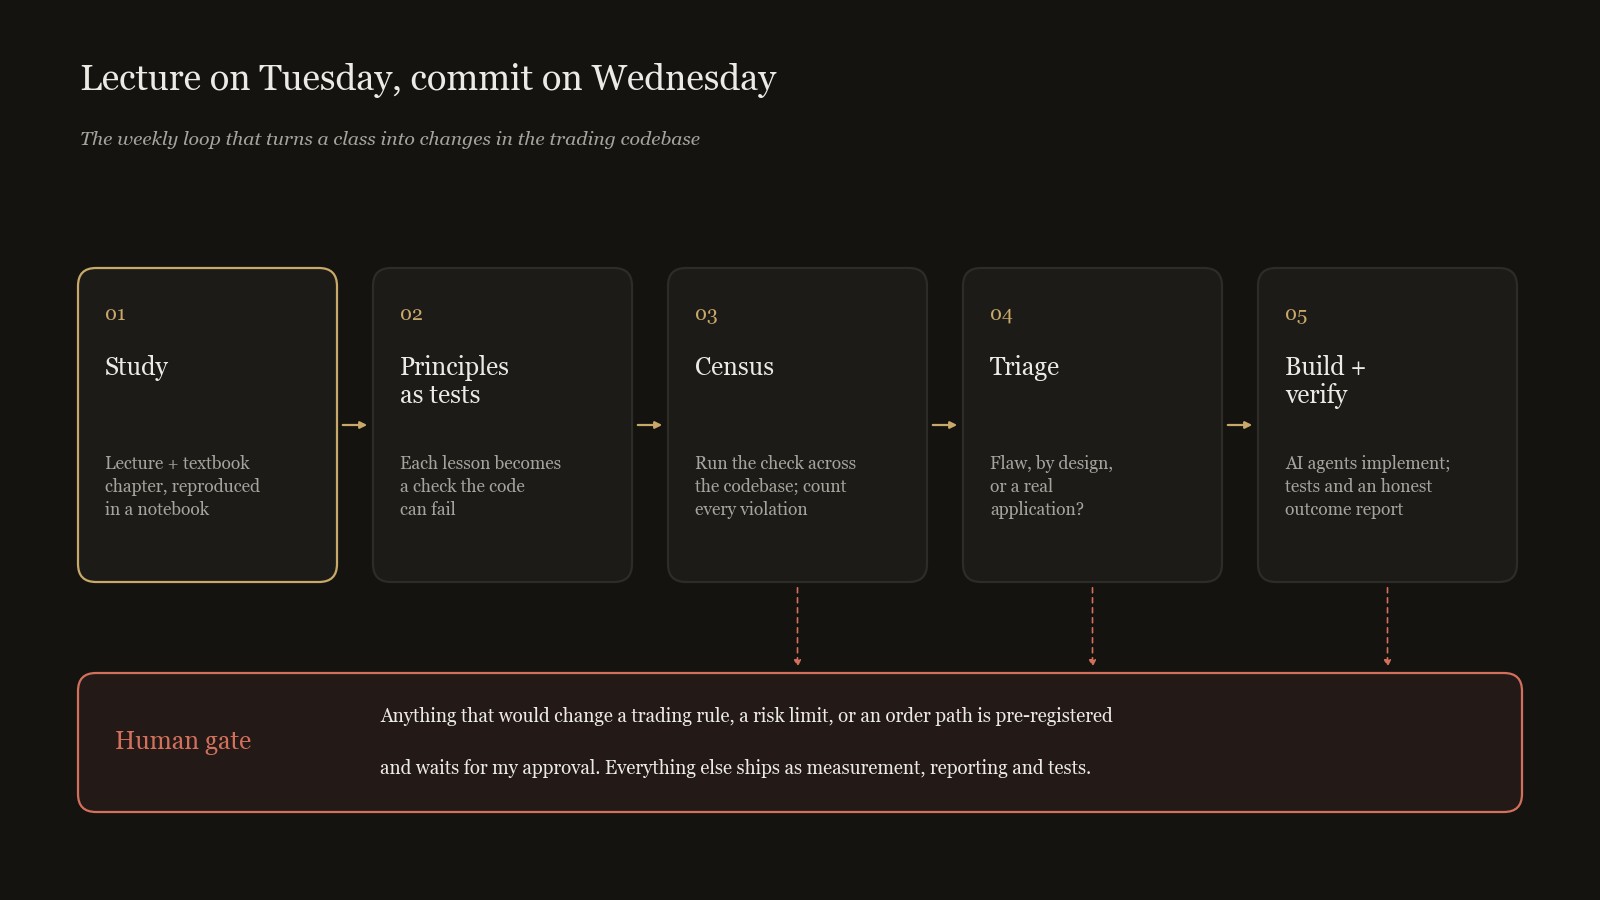
Each week runs the same seven steps. The diagram above condenses them into five boxes plus the approval gate:
- Study. Work the lecture in a notebook until I can reproduce the class examples exactly.
- Turn principles into tests. Each lesson becomes a pattern the code can violate.
- Census. Run that check across the whole codebase and count every violation.
- Triage. For each hit, decide whether it's a flaw, intentional, or a real application of the lesson.
- Pre-register. Anything that would change a trading rule, a risk limit, or an order path gets written down in advance and waits for my approval.
- Build and verify. AI agents implement the change, with tests and an outcome report that says what actually happened.
- Log it. Record what the course changed in the code, not what it taught.
The AI part matters here. A year ago a lecture like this would have ended up as a notes file. Now an agent can turn "you can only use the standard deviation on a symmetric sample" into a check that runs across the whole codebase the day after class. The human part matters just as much. Agents do the work, and I sign off on anything that touches money.
Week 1: look at the shape before you trust the number
The first lesson sounds basic and isn't: plot the distribution before you summarize it.
The mean and standard deviation are only a legal pair on a roughly symmetric sample. On a skewed one, the median and interquartile range tell the truth. The class example that made it stick was a small dataset with a few extreme values. The extremes inflated the mean and standard deviation so much that a three-sigma rule, the very tool meant to catch outliers, missed them. The median and quartiles never moved.
What changed in the code:
- Every number now carries its shape. Our claims layer already refused to show a value without its source and sample size. Week 1 added a third requirement: whether the sample is symmetric enough for a mean and standard deviation to mean anything.
- We re-read our own trade results. The existing report used the mean and a t-statistic. It now also reports the median, the interquartile range, an exact sign test, and bootstrap confidence intervals.
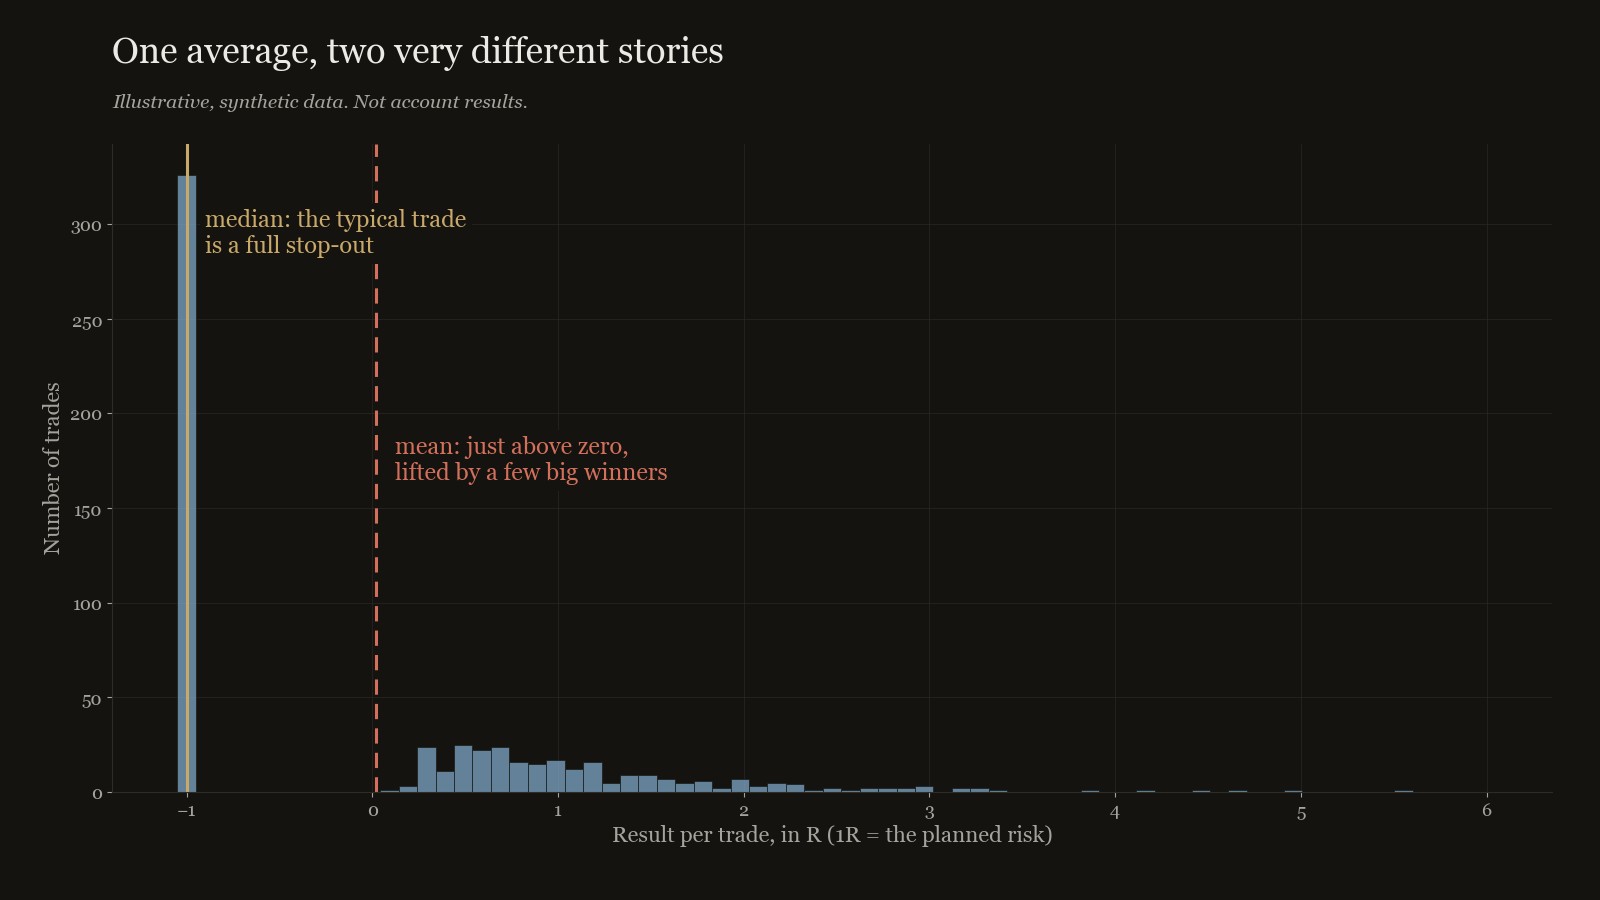
Illustrative, synthetic data. Not account results.
The re-read surfaced two things right away. In the sample we measured, the median trade was a full stop-out. The average had hidden that, because a smaller number of larger winners pulled it up. And the pooled result hid a regime split: trades in calm conditions worked, and trades in volatile conditions lost money on average.
Neither finding is a new strategy. Both change which questions we ask before any strategy gets more capital.
Week 2: "I took returns" is not a stationarity test
The second lecture's point, in the instructor's framing, is one most people get wrong. A series is stationary only if its mean, variance, and autocorrelation all stay constant over time.
"Prices aren't stationary, but returns are" is only true under the strongest random-walk assumptions. Real returns often have volatility that comes and goes in regimes. They can be centred on zero and still fail stationarity, because the variance moved.
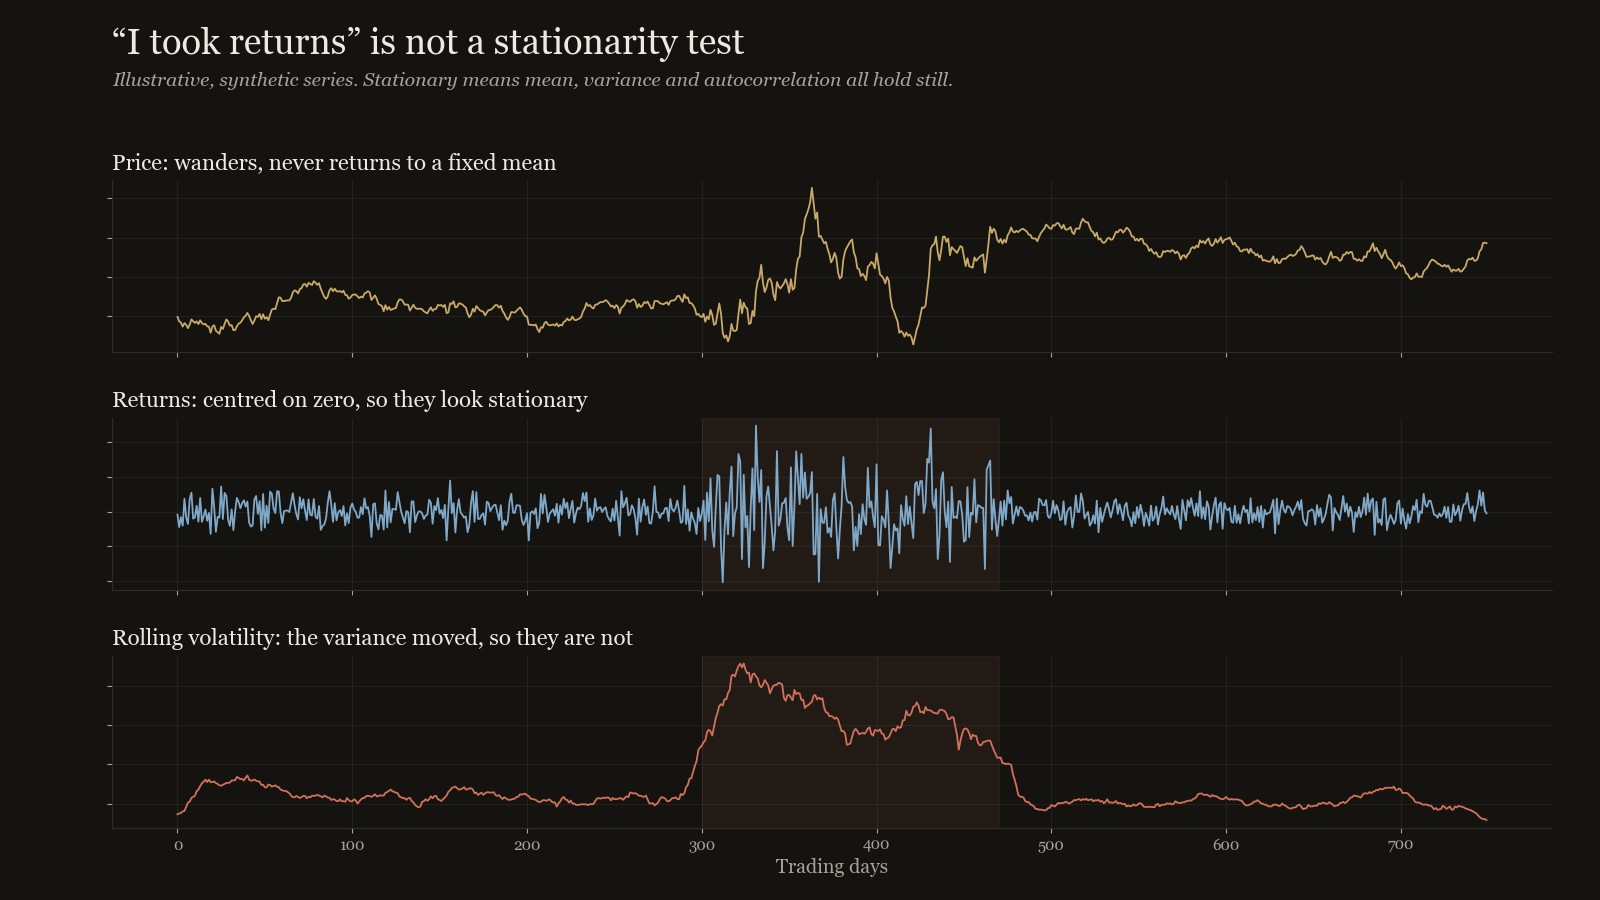
Illustrative, synthetic series.
A few corollaries I now treat as rules:
- A standard unit-root test starts from the assumption that the series is not stationary. Failing to reject that is not a pass.
- Differencing a series until the test turns green also erases its memory, and memory is what a model needs in order to predict anything. Fractional differencing keeps some of it.
- The teaching assistant added a useful limit: fractional differencing earns its keep on strategy PnL and return estimates, not as a rewrite of an existing entry signal.
Week 2's code application is still in the queue. So far its biggest effect has been on what I refuse to build.
Week 3: eight strategies, fewer bets
The third lecture was feature engineering, with one clear warning: don't dump every available factor into a model. A US stock has hundreds of candidate features. The discipline is domain first, then put everything on one scale, then drop the collinear copies, then compress what's left with principal component analysis (PCA). The first component is usually just "the market," and the last few are noise.
The same logic applies to a portfolio of strategies. If two strategies' daily results move together most of the time, they are one bet with two names.
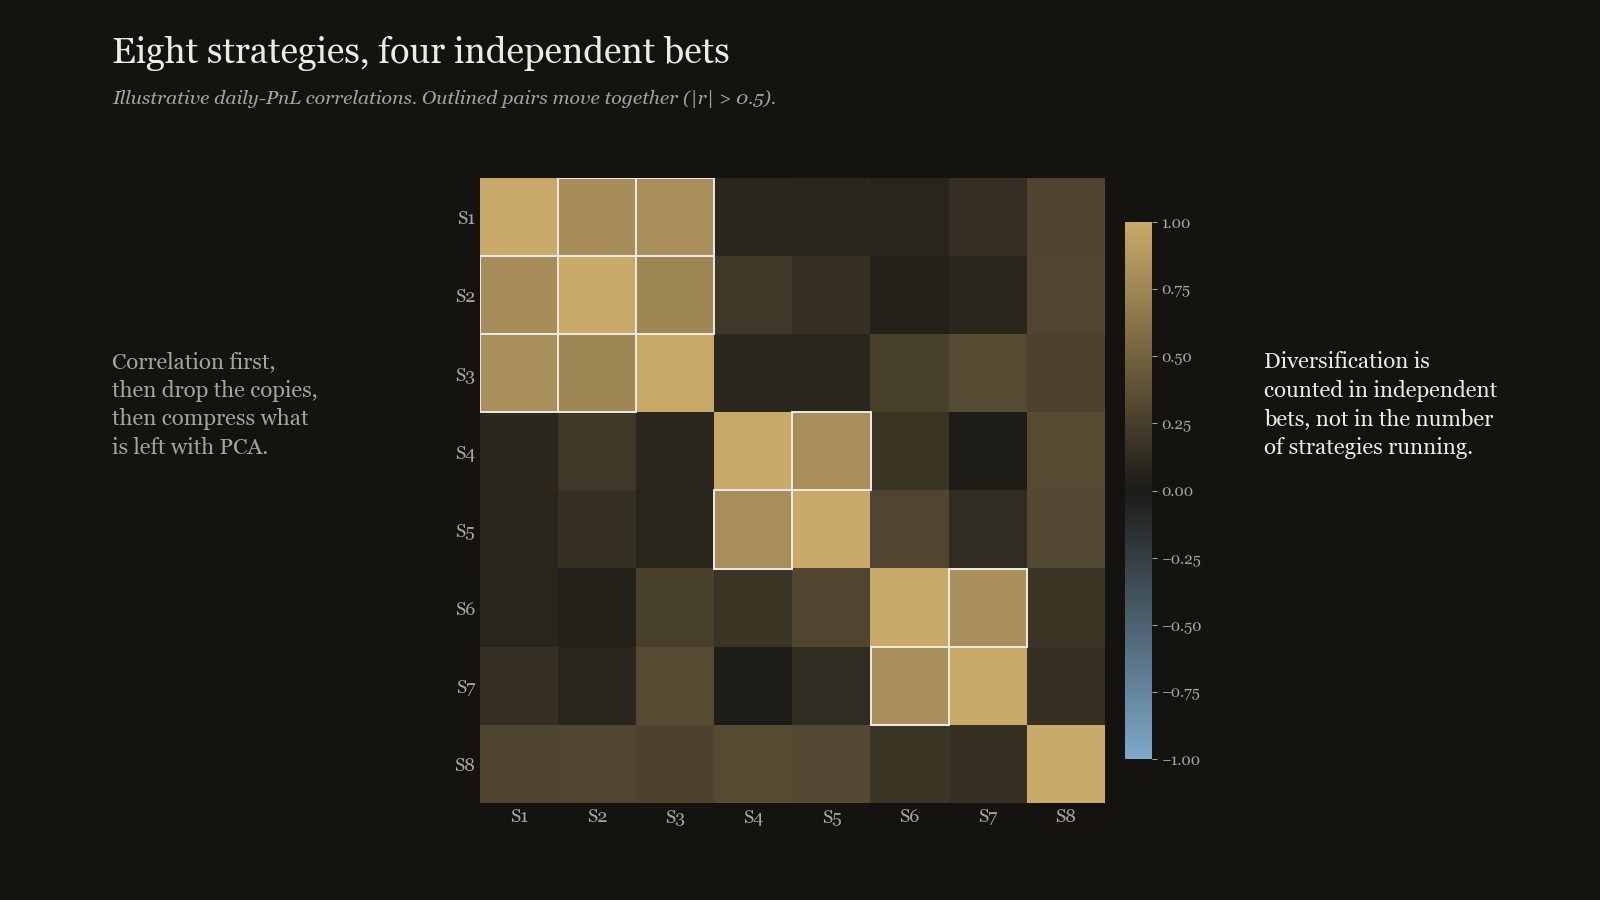
Illustrative, synthetic correlations.
What changed in the code:
- "Same bet" became a named report. It lists live strategy pairs whose daily results correlate above 0.5 and runs PCA on the same matrix to show how many independent bets are really there.
- Scaling follows the shape rule. Z-scores are used only on symmetric samples. Otherwise the code uses the median and interquartile range, which applies Week 1's lesson to Week 3's tool.
- A ratchet. A check now pins the places where live code z-scores raw prices, so that count can only go down.
None of this changed a promotion gate. My note on the week-3 log says it plainly: explained variance is not profit.
What this is not
This is not a claim that a Harvard course gave Traders.Money an edge. Everything that has landed so far is measurement: how we describe results, how we size, how we notice when two things are really one thing. None of it generates alpha, and I'm not claiming it does.
The later modules cover portfolio management with reinforcement learning. That will be built as a shadow system that only makes recommendations, never as live authority over capital. Capital is the one thing on the desk that fails closed.
Try it on your own trades
If you trade, here is the Week 1 lesson as a fifteen-minute exercise:
- Export your last 100 or more trades, with each result expressed in R (profit or loss divided by the risk you planned to take).
- Plot the histogram before calculating anything.
- Write the median and interquartile range next to the mean.
- Split the trades by a simple volatility regime, such as whether volatility was above or below its median.
- If the mean and the median tell different stories, believe the picture.
Resources
- Book: Matthew F. Dixon, Igor Halperin, and Paul Bilokon, Machine Learning in Finance: From Theory to Practice (Springer, 2020). No affiliation.
- Traders.Money Strategy Lab: free, paper-tracked strategy examples at traders.money/shadow. Disclosure: Traders.Money is my company. The Lab makes no promise about signal frequency or trading results.
A question for you
Which statistic are you trusting that you have never plotted?
Education, not financial advice. Trading involves risk, and past performance does not guarantee future results. All figures in this post use illustrative, synthetic data.

About Alec Furrier
Alec builds software and companies, studies difficult systems, and publishes the useful parts as public notes, resources, and tools.